MANAGING THE ECONOMIC EFFECTS
OF
TOTAL QUALITY MANAGEMENT
A DISSERTATION ON THE RESEARCH IN DEVELOPING
AN INTERNATIONAL STANDARD ON THE ECONOMICS OF QUALITY FOR THE INTERNATIONAL ORGANIZATION FOR STANDARDIZATION
B Mgt (IMC, London) B Com Hons (UBC London)
A dissertation dedicated to TC/176/SC3/WG3 working group members for the research and input that they have made since the inception of the ISO working group in 1991 at Madrid.
MEYERTON
January 1995
CURRICULUM VITAE - JOHANN GROBLER
Johann is a Quality Systems Administrator with EMSA (Pty) Ltd. and has 23 years service with the company. He is at present a member of the National Committee for Quality Management Systems at the South African Bureau of Standards, a Senior member of the South African Society for Quality, a Fellow of the Production Management Institute and registered as a Professional Production Manager. He holds a Bachelors degree in Management at the IMC from Buckingham (UK) and a B Comm Hons from the University Business College of London.
In a world of ever increasing competitiveness, it is imperative that Managers maintain effective control of their companies. Successful companies today emphasize management skills and systems. These skills are used to be able to measure the day to day performance. Without measurement, effective control is impossible. With the new political environment in South Africa, international trade has become a reality and companies that do not manage their companies according to accepted international standards (such as ISO) will not prosper. There is in fact a good chance that such companies will go under. South Africa is one of the largest users of ISO standards in the world and yet less than one percent (<1%) of local companies apply these standards. We are wasting the opportunities for international trade that exist. Time is becoming short and if we want to become exporters and not importers we MUST get our companies in order. Our economical future depends upon it.
This dissertation is dedicated to the research and philosophies of a committed group of people from all the corners of the world who serve on the International Organization for Standardization working group and are assigned the responsibility of developing an international standard for the Economics of Quality. There are no references to sources of literature other than the ISO International Standards for ISO documents should never advocate a specific philosophy. Acknowledgement and thanks are extended to the following working group members for their participation, dedication and vision towards quality.
| Ivo Verhaert | Belgium |
| Mrs. Lucia Videira | Brazil |
| Georges Assaiante | France |
| Dr. Klauss-Dieter Pohl |
Germany (International convener) |
| Guiseppe Pepe | Italy |
| John Marsh | United Kingdom |
| Robert Kennedy |
United States of America |
Their approach to the formidable task of developing an international standard has been exemplary in that, although we had differing view points, we were always able to achieve consensus. We realized at the outset that quality is a "people" subject that makes use of scientific tools. If I have forgotten somebody's name, please accept my apology. It was a honor and pleasure to work with all of you.
This dissertation can be used to understand the concepts of the International Standard which should be published in 1996. It must be stressed again that this dissertation must not be used as a standard, but rather as a complementary document. The international standard should appear as ISO 10014. The objective of ISO 10014 will be to act as an guideline to organizations who wish to improve or extend the span of control of their quality management systems. The dissertation has been written in contemporary English. The spelling of technical terms used in this dissertation correspond to the English used by ISO as specified in ISO 8402. All items in this dissertation are concepts and must not be regarded as an official ISO standard. Chapter 1 is dedicated to the explanation of how working groups function within ISO and the family of ISO 9000 documents that is being developed or reviewed while the rest of the dissertation is dedicated to economics of quality.
In the preparation of this dissertation, I would like to extend my thanks and gratitude to the following people for their support.
To Dr. P J Barnard of UCAR France, who during his time at EMSA advocated the philosophy of continuous education and improvement of people. Using people knowledge to raise the company to a level of total quality management that serves as an example to others.
To SABS who invited me to represent South Africa at ISO on the subject of Economic Effects of Total Quality Management.
To my wife Rencia, Gerhard, Johann and Liezl who are proof of a family that shows love and understanding.
Most importantly to God without whom our lives are meaningless.
1.1 Introduction
1.2 Structure of working groups
1.3 Participating members
1.4 Scope of the working group
1.5 ISO 9000 family of documents
1.6 Conclusion
References
CHAPTER 2 NEED OF A STANDARD FOR ECONOMICS OF QUALITY
2.1 Introduction
2.2 Introduction and scope to economics of quality
2.3 Definitions
References
CHAPTER 3 ORGANIZATIONAL OBJECTIVES
3.1 Introduction
3.2 Organizational objective
3.3 Using quality to reduce costs
3.4 Using quality to increase gains
3.5 Gain/cost ratio
3.6 Total quality management barriers
References
CHAPTER 4 CUSTOMER SATISFACTION
4.1 Introduction
4.2 Factors affecting and effecting customer satisfaction
4.3 Personal concepts
4.4 Customer-supplier alliances
References
CHAPTER 5 IMPROVING THE GAIN COST RATIO
5.1 Introduction
5.2 Adoption of a "tree diagram"
5.3 Necessary conditions for improvement
5.4 Managing the improvements
5.5 Pricing for business development
References
CHAPTER 6 IMPLEMENTATION AND MEASUREMENTS
6.1 Introduction
6.2 Measuring gain and costs
6.3 Measurement system
6.4 Budget for economics of quality
6.5 Analysis of performance control
References
CHAPTER 7 INFLUENCING CUSTOMER SATISFACTION
7.1 Introduction
7.2 Objectives towards customer satisfaction
7.3 Cumulative effects
7.4 Improving customer satisfaction
7.5 Effects on the gain/cost ratio
References
CHAPTER 8 HOW TO GET STARTED WITH A QUALITY COST REDUCTION PROGRAM
8.1 Introduction
8.2 Defining quality cost elements
8.3. Cost collection
8.4. Flow of cost codes to data base
8.5 Summary and analysis
8.6 Management review of quality cost reports
8.7 How do you budget for economics of quality?
8.8 Closing summary
References
ATTACHMENT I THE ECONOMICS OF QUALITY CALCULATING THE COST OF QUALITY
Economics of quality has been with us for many years and the concept of prevention, appraisal and failure costs has been taught to students for many years. Several other models such as the process cost model have also made its appearance. However most, if not all of these models or theories have been applied with little success in industry. Companies have tried to implement quality costing as a separate tool from the other management functions and due to factors such as time, cost and commitment have seen these efforts die at an early stage. The only way that economics of quality will become a reality is when international trade and the resultant competition forces companies to look at the cost of their products and service.
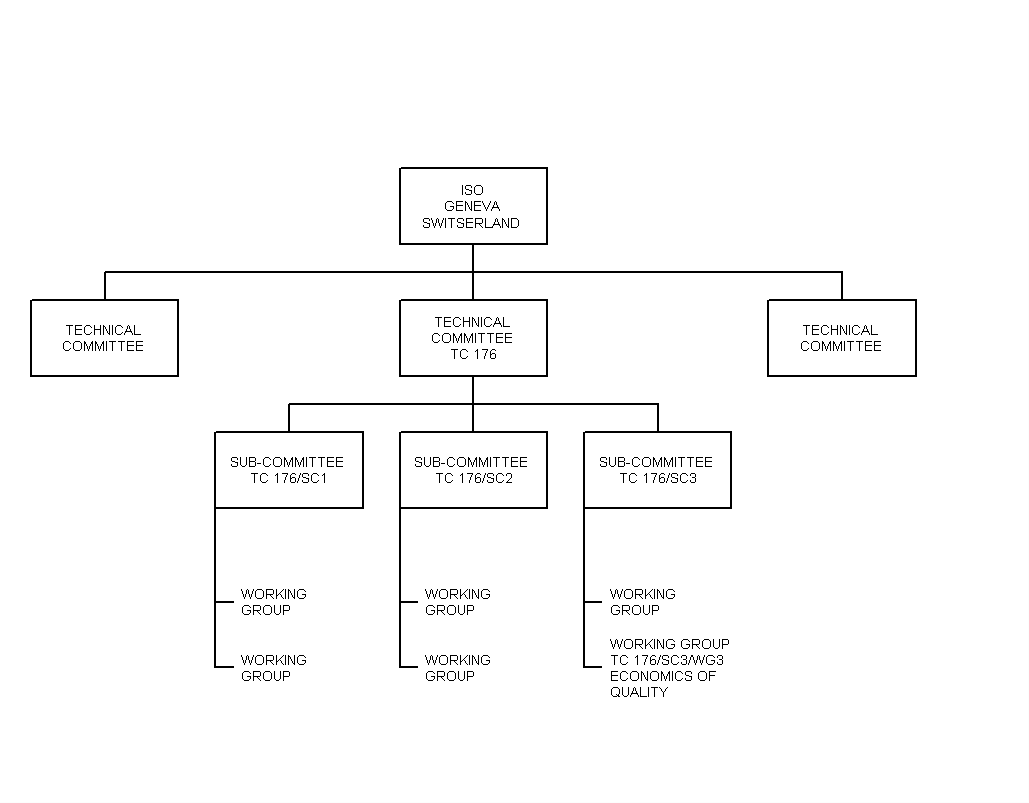
This chapter is devoted to the technical aspects of working groups as this is not commonly known in industry and it is important that industry should know where International Standards originate from and to give their support to national institutions such as the South African Bureau of Standards, British Standards Institution etc.. A Technical Committee TC 176 was established by ISO (International Organization for Standardization) in Geneva with the objective of setting standards for quality management systems. This has resulted in the present ISO 9000 series of standards. These standards have been accepted by all the major trading countries as a means of establishing common ground for quality.
As ISO 9000 started being adopted by many countries a need for more specific guidelines on the various elements of ISO 9000 developed. This has led to the development of the ISO 10000 series of documents. Some of these standards have been published, but many are still in the development stage. The economics of total quality management is one of the standards presently being developed. In order to develop standards, experts from various countries are nominated to sit on working groups with the directive to develop an universally accepted standard. This work can take up to seven years before the standard is published by ISO. It is my privilege to sit on such a working group. Not only do you make a contribution towards the standard but the knowledge and insight that is gained from the other participating members is incalculable. Many of the developing countries attend the meetings as observers with the sole objective of learning. In order to gain insight into the functions of working groups, it is necessary to understand the rules laid down by ISO.
Working groups are a part of a highly formalized structure within ISO and for clarity the structure in figure 1 depicts the organizational structure of ISO with emphasis on Technical Committee 176 responsible for quality management systems. ISO have specific guidelines as to the structure of a working group and in their code of practice state:
"A working group comprises a restricted number of individually appointed experts brought together to deal with the specific task allocated to the working group. The experts act in a personal capacity and not as the official representative of the P-member (country) or A-liaison (organization) by which they have been appointed. However it is recommended that they keep close contact with that P-member or organization in order to inform them about the progress of the work and of the various opinions in the working group at the earliest possible stage". [1]
It is usual that the working group be reasonably limited in size, as too many members can compromise the effectiveness of the group. It is also common that only one representative per country be allowed to participate in order to prevent any national bias from dominating the contents of the standard being developed.
There are two categories of members in a working group:
Participating members are the experts appointed to develop the standard, whilst observing members are exactly as to what their status is defined. The convener (chairman) of a working group has the right to limit the number of observers attending meetings and if observers do not observe protocol, he has the authority to dismiss the observers.
These administrative powers of the convener are essential in order to ensure continuance of group activities. The acceptance of ISO 9000 in the business world has led to more countries electing to participate in the development of standards and to gain more knowledge. A good example is mainland China, who have had observers on the subject of economics of quality at the Australia and Hungary meetings. Their conduct during these meetings were exemplary, giving substance to the seriousness of China wanting to enter the international scene. Observers of the same caliber as the China delegation are always most welcome to attend working group meetings should the venue have sufficient accommodation for observer attendance.
The primary duty of a working group is the development or systematic review of International Standards. International Standards are developed on the basis of a project approach. This approach allows the systematic development of International Standards and allows participating members/countries to give additional input as the document develops.
From the committee draft (CD) stage up to the Draft International Standard, participating members/countries are entitled to vote for or against the document. It is therefore not unusual for an International Standard to take several years from the proposal stage up to its conclusion as an International Standard. Often it is that a revision to an International Standard is being undertaken before the original document has been published due to additional information and/or concepts that developed during the Draft International Stage (DIS). At the DIS stage only editorial changes are permitted.
The progress of the working group is made known through periodical progress reports to the technical committee. These reports are submitted by the convener of the working group.
Figure 2 depicts the sequence of project stages through which the technical work is developed and gives the name of the document associated with each project stage.
|
PROJECT STAGE |
ASSOCIATED DOCUMENT |
|
|
NAME |
ABBREVIATION |
|
|
1. Proposal Stage |
New work item proposal |
NP |
|
2. Preparatory Stage |
Working Draft |
WD |
|
3. Committee Stage |
Committee Draft |
CD |
|
4. Approval Stage |
Draft International Standard |
DIS |
|
5. Publication Stage |
International Standard |
- |
A working group project can take several years and therefore there is a time limit of two years for a working draft, a committee draft within five years and publication within seven years. A project shall be cancelled unless its retention is justified and confirmed by a majority vote of the P-members of the technical committee or sub-committee. Each member of the international working group is normally also convener of his own working group at national level. This allows the member to have access to further sources of information and be fully prepared when participating in international meetings.
Not all of industry is aware of the fact that ISO quality management system documentation consists of more than just ISO 9000-1 to 4, 9001, 9002, 9003 and 9004-1 to 4. There are additional documents that have been published or are being developed. Within the context of this dissertation only the ISO standards developed by the technical committee TC176 will be discussed. There are 4 categories of standards and guides within the ISO 9000 [2] family of documents of which ISO 9001, [3] 9002 [4] and 9003 [5] are mandatory standards to be complied with if companies wish to achieve accreditation under the listing scheme. ISO 9000 has become a requirement of international trade (especially with the EEC countries). It is because of this requirement that more organizations should strive for accreditation under the listing scheme if they wish to be able to penetrate the European market in order to survive. It will be noted that SABS-ISO standards are national standards and within the bibliography of each published standard reference is made to ISO standards. These are informative references and do not necessarily imply that these ISO standards have been accepted as national standards for South Africa. The ISO standards' national status in South Africa as at 24 November 1994 are discussed. The following categories of standards and guides exist:
These are ISO 9001, 9002 and 9003. These are the standards under which companies achieve accreditation. It must be noted that these are the only standards that are enforceable by auditors. The other members of the ISO 9000 family of documents should be treated as "nice to have" or "nice to know". This means that they can be implemented at the prerogative of the company.
These are ISO 9004-1 to ISO 9004-2 [6]. They are quality management and quality system guidelines. ISO 9004-3 and ISO 9004-4 have been published by the International Organization for Standardization and are to be considered for publication as national standards in South Africa. These guides do not prescribe specific methodology as the specific methodology is the prerogative of the company or organization. They should be seen as holistic documents designed to stimulate the management thinking of companies. A further series of guides, under ISO 9004, are being developed for industry in order to broaden the scope of management tools in industry. Companies that wish to achieve ISO 9000 listing should be wary of placing guidelines into their quality management systems, whether it be an own decision or on the advice of consultants. The more you write into the system the more you open yourself up to unnecessary audit findings. A quality management system should be holistic and simple to ensure total understanding and control.
At present there is only one ISO standard that has been published as a national standard, ISO 9000-1 [1]. ISO 9000-1 is titled "Quality management and quality assurance - Guidelines for selection and use". The title is self explanatory. Three other standards that have been published by ISO and not yet adopted for South Africa are ISO 9000-2 to 4 and covers the following subjects:
These are known as the "10000" series of guides. ISO 1011-1, 1011-2 and 1011-3 [7] have been published by ISO and are directed at auditing. These documents are to be considered for adoption as national standards. Although these auditing documents are guides, it is my personal opinion that they should rather have been standards. Standards would lead to the professionalism of auditors and their methods of auditing. The following standards have also been published by ISO and are under consideration for adoption as national standards:
ISO 10012-1 - Quality assurance requirements for measuring equipment - Metrological confirmation system for measuring equipment.
ISO 10013 - Guidelines for developing quality manuals (Still in Draft International Standard stage).
ISO 10014 - Guide to the economics of quality management (Still in Committee Draft stage).
SABS ISO 9004-1 refers to ISO/TR 13425, Guidelines for the selection of statistical methods in standardization and specification. This document was developed outside TC 176 and cannot be commented upon. It is under the category of quality technology (ISO 10000 series) that the work on the Economics of Quality is being developed by the working group.
There is only one standard and that is ISO 8402 - Quality management and quality assurance - Vocabulary [8]. This standard is essential in industry and within the ISO Technical Committee. Without this standard it would be an impossibility to develop standards and guidelines due to the various interpretations of words or phrases.
This chapter was devoted to giving the reader an understanding of how International Standards are developed and why ISO standards are so important and necessary for international trade. At the 1994 ISO meeting in Toronto, Canada, two hundred and seventy-six delegates from thirty-nine countries and nineteen liaison members were present. This is an indication of the importance that the major trading countries attach to the ISO standards. It is wise to remember that common standards lead to common grounds of understanding and application.
[1] International Organization for Standardization - Code of Practice for development of standards. (Internal publication).
[2] ISO 9000-1:1994, Code of Practice, Quality management and quality assurance standards. Part 1: Guidelines for selection and use. ISBN 0-626-09905-6.
[3] ISO 9001:1994, Code of Practice, Quality systems - Model for quality assurance in design, development, production, installation and servicing. ISBN 0-626-09906-4.
[4] ISO 9002:1994, Code of Practice, Quality systems - Model for quality assurance in production, installation and servicing. ISBN 0-626-09907-2.
[5] ISO 9003:1994, Code of Practice, Quality systems - Model for quality assurance in final inspection and test. ISBN 0-626-09908-0.
[6] ISO 9004-1, Quality management and quality system elements. Part 1: Guidelines. ISBN 0-626-09909-9.
[7] ISO 1011-1 to 3, Guidelines for auditing quality systems. ISBN Number not yet allocated.
[8] ISO 8402:1994, Quality management and quality assurance - Vocabulary. ISBN Number not yet allocated.
Industry has tried to look at the concept of economics of quality for many years as a cost reduction tool and have applied the PAF model (Prevention, Appraisal and Failure costs) with very limited effect. The same can be said of the Process Cost Model. The reason for this is that the PAF model only looks at production costs and as a result only addresses a small portion of the total costs that are incurred by the company. Many actual costs are hidden under the title of overheads and it is these costs that must be identified and addressed [1] (See Attachment I). There is, however, a third element that cannot be easily quantified and that is the element of customer satisfaction. Although it is difficult to measure it is the most important element of all as it determines whether your business prospers, just survives or goes under. Growth is the key word for any business, whether it be selling a product or service "for profit". Even an organization that delivers a "not for profit" service to industry or the community must maintain some form of economics or it will not survive.
The need for an International Standard from ISO was proposed with the above concepts in mind. Economics of quality as part of total quality management must take in account all the above concepts if it is to become a viable management tool. The proposal for the standard was accepted in 1990 at Interlaken and the first meeting of the international working group took place in Madrid in 1991. The South African working group started preparing its input during July 1991 and submitted its first document to the Madrid meeting. Due to the fact that the author could not attend the meeting, this document was rejected out of hand. Things, however, took a more positive note when the author attended the Australia meeting and was able to explain the viewpoint taken. This has led to the broadened scope of the working draft. Good interaction between the members has led to a document that should change industry's thinking on the subject of economics of quality. It was interesting to note that all members had the same understanding of the subject and the real concern was; "How to put it all down on paper". This task proved to be formidable but was achieved in Australia and the subsequent meeting in Budapest. We will now address the economics of quality and the concepts thereof.
During the meeting at the Surfers Paradise in Australia, The working group refined the introduction of the document. It was agreed that the document should be as generic as possible. To advocate a specific methodology internationally would meet with opposition and could lead to dissention in the world of quality. The concept agreed upon was to produce a document that enabled prospective users to understand the fundamentals of the subject and then decide for themselves which methodology to use. The working group agreed upon the following draft as an introduction:
"This guideline aims to show that by understanding and applying the economic effects of Total Quality Management the organizational performance can be enhanced [2]. In the past, emphasis has been incorrectly placed on the use of Total Quality Management principles for the reduction of costs rather than using them to increase income. In many industries, various models have created the impression that quality is always related to costs. This has led to wrong assumptions and has created a negative atmosphere towards Total Quality Management. To create a positive atmosphere towards quality improvements, the concept of benefit and profit has to be added to quality related costing. This consideration requires new terms and definitions. This guide to the economic effects of Total Quality Management will cover the aspects of increased income and reduced costs.
This International Standard is intended to provide guidance to persons carrying responsibility for acquiring and fulfilling customer requirements. It is not intended to mandate any specific methodology, nor is it intended that any other ISO standard utilize the content of this international standard as a normative reference. In this International Standard the words "Quality" and "Grade", whilst agreeing generally with the definitions in ISO 8402, additional emphasis is sometimes given in the following connotations:
This introduction and scope has been carefully worded by the working group to ensure that users become aware of the fact that quality is everybody's business and can be applied by all whether in industry or social services. It must be realized that the working group members are people from industry and service who have to develop a standard for the international community.
The ISO group of documents use terms and definitions that are contained in ISO 8402. During the development of a new standard, new terms and definitions are developed. The following definitions were developed in order to have clarity on items specific to the economics of quality:
These definitions were developed within the context of the economics of quality. These four definitions are the basis upon which this document has been developed and as you progress through this dissertation you will understand that this is the very fundamentals upon which Total Quality Management is built. It must also be added that without people, these concepts of the fundamentals of quality are not possible. At the time of this dissertation, all the definitions have not yet been ratified by the committee responsible for ISO 8402 and it could be that these definitions may not be required as part of the ISO-8402 vocabulary.
[1] Grobler, J W. The economics of quality - Calculating the cost of quality. International Institute for Research, Presentation on 21 Oct. 1992.
[2] ISO TC 176/SC3/WG3, Working group introduction. ISO meeting Australia 1992, No reference.
[3] ISO 9004-1:1994, Code of Practice, Quality management and quality system elements. Part 1: Guidelines, Chapter 6, para 6.2.2(b),1)
[4] ISO 9004-1:1994, Code of Practice, Quality management and quality system elements. Part 1: Guidelines, Chapter 6, para 6.2.2(b),2)
[5] Proposal made by Ivo Verhaert from Belgium, ISO meeting Australia 1992, No reference.
[6] Proposal made by Johann Grobler from South Africa to Brussels meeting, 1993, No reference.
Organizational performance is the bottom line of any company or institution. These are measured in terms of profitability or the level of service it has rendered. This can be expressed simply as the benefit gained by the supplier and the customer. The term benefit [1] was decided upon by the working group, as the perception of the term profit did not always fit in with the concepts of various applications. The non-delivery of benefit by not "for profit" organizations so often lead to declining membership/funding and eventually the demise of the institution. How often is it not found that an institution exists in name only with two or three people being the total membership. Being an institute and not registered in terms of the companies act, they can exist for years on paper and deliver no real benefit.
"For profit" companies have a different scenario in that they either survive or go under.
All businesses and organizations must have a primary purpose. They should all seek to maximize their gains, whether it be "for profit" or "not for profit". There are two types of businesses and organizations. Those that deliver a product and those that deliver a service. Products are tangible items and are mostly consumables. With regard to service there are two perceptions. Some people see service as banking, consulting and similar businesses. To me this is only one aspect of service. They are selling you a product with the profit motive as incentive. Service should also be regarded as those services rendered by institutions who do not have profit as their primary purpose.
Good examples are government or local institutions that render social service to the communities that they serve. They are dependent on financial grants received from governmental budgets (The taxes that you pay). Thus the application and usage of such grants by institutions will determine their continued survival. What is common is that both groups perform work and produce outputs with a specific customer in mind. It is highly probable to find both "for profit" and "not for profit" operations within an organization. A good example is where a division supplies a product to another division within the organization for processing whilst the same product is sold on the open market. It goes without saying that the product is sold outside at a profit whilst the same product is passed on within the organization at cost only. This concept has been drafted by the working group to read as follows:
"Every activity within an organization should be directed towards the fulfillment of the customer requirements. These activities are linked to form processes (ISO 9000-1 may be consulted) to produce desired products. Once the processes have been identified and accepted all outputs should fulfill the requirements of the customers. Similarly the process requirements for the inputs should be established in order to achieve desired outputs. The process then transforms the inputs into the desired outputs. Every process receives inputs as a customer of previous processes. All the costs incurred in the process can be distinguished either as cost of conformity or cost of nonconformity.
All businesses and organizations may be divided into two types. Those that intend to make a profit ["for profit"] and those that do not ["not for profit"]. Organizations of either type perform work and supply products (hardware, software, processed materials or services as mentioned in ISO 9000-1). It is possible to have both "for profit" and "not for profit" operations within organizations. All organizations have a primary purpose, e.g. maximize its gains. For commercial "for profit" organizations the primary purpose is to maximize its gains and to achieve benefits. In the case of a "not for profit" organization the primary purpose is to maximize its gains, value of the service as perceived by its customers. In either case the organization is attempting to maximize the ratio of gain to cost. This ratio may be called the gain/cost ratio. Total cost is made up of the cost of conformity and the cost of nonconformity". [2]
No organization is in business without a specific objective. They must have been founded after extensive market research determining the need of a product, the possible consumption and the estimated product life.
"The costs of nonconformity in the turnover of an organization is a significant part of the amount of this turnover, greater often than the benefit in the case of "for profit organizations". The analysis of the cost of nonconformity, their classification and their measures permit to know the potential reduction costs we can obtain by the complete elimination of nonconformity parts and how to manage them". [3]
The quality management process reduces as much as possible these costs.
Total quality management must not be seen as a tool but rather as a philosophy that underscores the corporate strategy of all organizations. Therefore, to increase gains, you must address all aspect of quality management and incorporate into the corporate strategy. You must look at the total picture and not just one specific element. The marketing of existing products and services must follow the same concepts than those of quality management for design and manufacturing. By market survey the organization can adapt its products to the evolutionary market and maximize the quality of services to the user; a permanent control of the level of satisfaction of customers can indicate the necessary actions to retain existing customers or gain new customers and increase the reputation of the organization. The final result is the improvement of gains by improvement of quality of marketing and sales. The organization management can decide structure modifications and/or creates new products to reduce costs of conformity and increase gains of sales. The chart (see figure 2) illustrates the influence of these different concepts [4] on the improvement of gains and reduction of cost by quality.
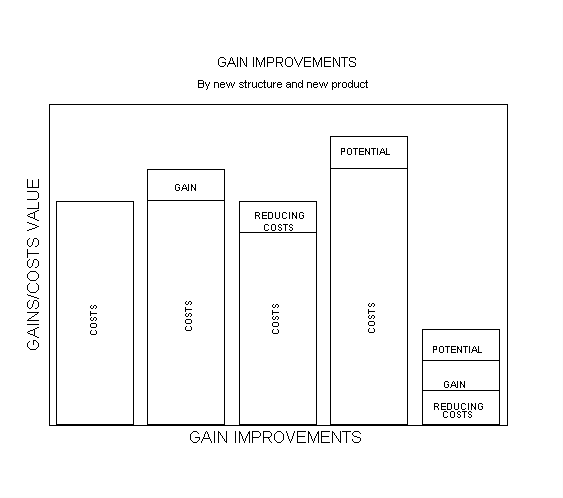
Gain Improvements
The sum of gain and cost in terms of production and sales can be regarded as turnover. Therefore gain is the benefit made after all the costs (tax included) have been deducted from the turnover. This is a very simplistic view and should be interpreted within the context of this dissertation. "Not for profit" and "for profit" organizations are attempting to maximize the ratio of gain to total cost. this ratio may be called the "gain cost ratio". Total cost is made up of the costs of conformity and the costs of nonconformity. In the case of a "for profit" organization, the gain/cost ratio is:
Gain/Cost ratio = Gains in terms of profit / costs
In the case of a "not for profit" organization, the gain/cost ratio is:
Gain/Cost ratio = Gains in terms of perceived value of service / costs
It has been seen that an organization may significantly improve its gain/cost ratio through an emphasis on quality improvement. The reduction of cost is relatively limited when compared to potential increases in gains. An even more effective way to improve the gain/cost ratio is to provide more of the existing products, to supply more profitable and/or satisfiable products. It is, however, true that the first benefit to be gained from an economics of quality program is the reduction of costs. This where organizations fail to follow through with the program by increasing gains. Thus the limited success.
Total quality management extends beyond the scope of quality control, quality assurance, quality management and total quality. Total quality embraces the aspect of continuous improvement in all the activities of an organization. Organizations that have accepted and implemented this philosophy are far and few. An organization complying with the above statements have reached that level of quality by applying total quality management as part of their daily routines without it being written into policy or procedures. It is a way of life for them. Many companies and organizations are striving to achieve this level. There appears to be much confusion as to what total quality management stands for. Some people are trying to define total quality management by placing items such as change, corporate culture, into boxes. This means that they see each of these as separate entities. It must be understood that total quality management should be seen as a single integrated approach to the four areas of management's organizational being. Thus total quality management must be seen in an organization as the organizational consistency and harmony which are vital to corporate strategy and its impact on the external market. [5] Total quality management should be seen as the amalgamation of teams, methods, internal markets and leadership. You must adopt an holistic approach to the concept of total quality management.
Teams are essential within an organization as they are the most suitable vehicle within which problem solving and implementation can be achieved. Care should however be taken to prevent teams from becoming self-serving and superficial. Teams should be established to address real tasks and disband when they have achieved their objectives. There are basically five kinds of teams to be found within an organization with the objectives of:
Total quality management emphasizes that everybody in the organization must have the tools and a system to appraise their own performance, act upon the results, review and continuously improve what they are responsible for. Therefore to facilitate communication; policies, work procedures, specifications and standards must be fully documented. It may also be required by your customers that this be certified or listed in terms of the requirements of ISO 9000. Many companies think that listing is their own decision, however, what they do not disclose is the pressure from customers.
Internal markets addresses the establishment or creation of a market (Customer) responsive organizational culture. Communication between employees is of paramount importance. This includes top/down communication, bottom/up, and cross sectional communication on all matters affecting quality as well as personnel matters such as recognition, rewards, employee support and training. This aspect should also include items such as corporate climate, communications and external relations.
Leadership in terms of total quality management must be inherent in quality committed senior management in order to ensure that the principles of total quality management are continuously implemented. There must be a driving force or else total quality management will fail. All levels of management must participate in total quality management in order to encourage full participation. Senior management must constantly address and improve the following issues:
Therefore it can be said that total quality management means managing the whole organization and extend relationships with customers and suppliers. This not an overnight achievement and there will be many teething problems to sort out such as:
[1] Proposal made by Georges Assaiante of France, ISO meeting Budapest 1993, No reference.
[2] ISO TC176\SC3\WG3, Working group draft, ISO meeting Australia 1992, No reference.
[3] Proposal made by Robert Kennedy of the United States Of America, ISO meeting Australia 1992, No reference.
[4] Proposal made by Georges Assaiante of France, ISO meeting Budapest 1993, No reference.
[5] Wilkinson A, Witcher B, Fitness for use? Barriers to full TQM in the UK, Management Decision, Vol 29, No 8, 1991, pp. 46-51, MCB University Press Ltd, 0025-1747.
In addition to reducing internal costs, a comprehensive improvement program can increase the gains of an organization. The potential economic benefits of increasing gains can be many times as large as those by reducing internal costs. Higher gains may be obtained by a "for profit" organization through increasing market for current products, charging a higher price which customers feel is warranted, or offering a new product entering a new market (See figure 2 in chapter 3). None of these are possible, unless organizations are superior in the eyes of the customer. Customer satisfaction is the result of the number of positive and negative factors which are experienced by the customer. It includes the combination of how products meet the customer needs and the way organizations deal with the customer.
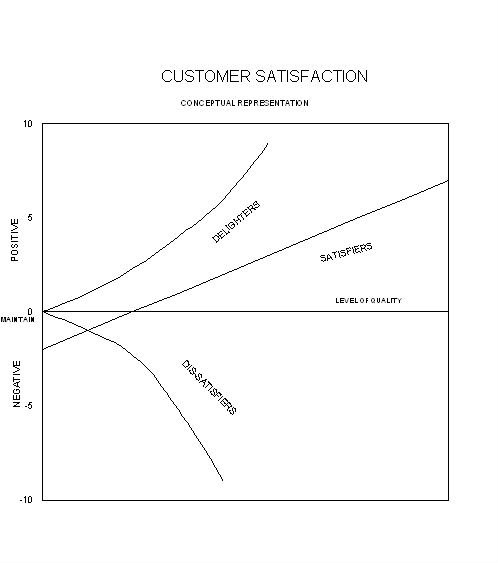
Figure 3 Customer Satisfaction - Conceptual Representation
Customers will develop a singular level of satisfaction for a given set of circumstances. It will be influenced by three general factors. The factors, as developed by Kano [6], which have been identified as: dissatisfier factors, satisfier factors and delighter factors which is shown conceptually in figure 3. Satisfaction is only determined in the customers mind. It can not be predicted with precision. The factors described here do not result in three separate customer reactions. The supplier should attempt to identify, plan and manage, giving consideration to the factors and customers' reaction to them. At this stage the author raised the concern of adopting the commercial philosophies of an individual into an international standard. Common knowledge and logical thinking should prevail at all times. It is also often found, that if a model is placed into a standard, that the intended users will want to apply the model in industry. This usually has negative consequences.
Dissatisfier factors are negative conditions or events which are expected not to happen. If they are present, customer satisfaction decreases. If no dissatisfier factors are present, the customer satisfaction does not go up, it simply does not go down. Examples of dissatisfier factors are: nonconforming product, delivery problems, problems in obtaining service, uncooperative staff or indifference to customer questions or complaints. These situations are considered as much more significant by the customer than the organization may realize. It is necessary to go beyond merely not offending customers. The satisfier and delighter factors must also be addressed for total customer satisfaction. [1]
Satisfier factors are expected conditions or events which are proportional in their effects on customer satisfaction. A simple reduction in price or an increase in responsiveness are examples of satisfier factors. If the price of a product is reduced, it is a better value and the customer is more satisfied. The offering of a range of product styles, options, models i.e. choices, are satisfier factors. The more satisfier factors present, the higher the customer satisfaction. It should be seen that a satisfier factor does not compensate for a dissatisfier factor. For example, the low price paid for an item or fast response is quickly forgotten, if the product was nonconforming upon receipt. [2]
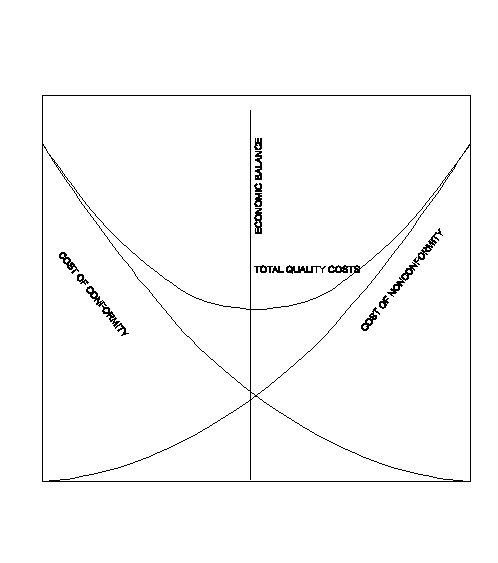
Figure 4 - Total Quality Costs
Delighter factors are any practices, product features, services or attributes which are very positive to the customer when experienced but were not expected or specified. An example of an hotel will illustrate these factors. If a traveler was to check-in to a hotel only to find that the reservation had been lost, the room was dirty and the air conditioning was inoperative, the traveler would be very dissatisfied (three dissatisfier factors). If another hotel offers reduced room rate and provides free transportation to the airport, these are satisfier factors. If the hotel staff knows the customers name when checking in, the television has programs in the customers native language and the customer finds a basket of fruit in the room, these may be delighter factors. [3]
The author disagrees with the use of the words; dissatisfier, satisfier and delighter as they are phrases developed by an individual and therefore advocates that individual's philosophy. The philosophy of the individual is true for it is common knowledge. The terms used in ISO standards must be generic at all times. Thus figure 3 would be better represented using common terms as illustrated in figure 4. It can also be stated the prevention, appraisal and failure could be adapted to measure the gains or losses made with an economics of quality program. The Prevention, Appraisal and Failure (PAF model) [4] is not unique as it is found within many other financial disciplines. It is interesting to note that there is a similarity between figure 4 and the PAF model if the PAF model is placed horizontally (See figure 5). Both models make use of a centre line. The only difference is the start of the lines. One starts from the centre while the other starts from the outer edges. Figure 4 uses concepts to illustrate the effects whilst figure 5 uses monetary values to express the measurements. It must be remembered that these are theoretical models and will not reflect what takes place in actual practice.

To achieve customer satisfaction it is important to have some form of customer supplier alliance with the motivation lying not necessarily in the short term, but in the projected long-term benefits derived from the skills of the supplier and the strengths of the customer. This is a different view taken from other academics in that the customer can make use of the expertise of the supplier in supplying a product that will meet his needs. This alliance can be profitable for both parties in that a product can be developed at the lowest cost and price and still have the required quality. This emphasizes the aspect of over quality. [5] With such an alliance both parties need to understand the issues involved, the potential benefits, the importance of being a lower cost producer and the implications of adapting the sales function.
To achieve a long-term relationship it is important that both parties are inherently stable, that management is of a high caliber and that there are mutual objectives. Care should, however, be taken that there is a balance between customer and supplier to ensure that the one party does not become dictatorial. This often found to be the customer that is a major organization and the supplier a small concern. An important aspect of an alliance is that the sales team of the supplier is not just asked to deliver the product on time, he is also required to understand in great detail the customer's application of the product. This could mean the sharing of technology to achieve a mutual objective. A good example of shared technology can be found in the aeronautics industry. Customer-supplier alliances can demand a significant investment in resources but the benefits can be mutually beneficial. To achieve a profitable and successful customer-supplier alliance the following criteria should be met:
It will be noted that the above criteria is part of the principles of total quality management and the element of trust in a customer-supplier alliance is a significant factor.
[1] ISO TC176\SC3\WG3, Working group draft, ISO meeting Stuttgart 1992, No reference.
[2] ISO TC176\SC3\WG3, Working group draft, ISO meeting Stuttgart 1992, No reference.
[3] ISO TC176\SC3\WG3, Working group draft, ISO meeting Stuttgart 1992, No reference.
[4] Caplin R H, A Practical Approach to Quality Control, Business Books Ltd, 1982, ISBN 0 09 147451 5.
[5] Burdett J O, A model for customer-supplier alliances. Management Decision, Vol 29 No 5, pp. 28-34, MCB University Press Ltd, 0025-1747.
[6] Kano, This concept was first encountered by the author during the meeting in Australia. The Terminology is still part of the Committee Draft for the economics of quality, but the graph as illustrated in figure 4, has been removed. ISO/TC 176/SC3/WG3/N50, 12 January 1993, Committee draft.
An organization needs to identify the best ways to improve the gain/cost ratio. Improvements can be achieved in two ways: either increasing gains and/or reducing costs. To achieve the objectives using the best method, management should always have some methodology (Tools) with which they will be able to improve the gain/cost ratio.
By adapting a tree diagram, [1] as shown in figure 6, to the organization the main potential benefits can be shown hence enabling the most effective use of resources. The tree diagram is a useful management tool in setting objectives and determining priorities in terms of strategy, planning, organizing, directing and control.
The person responsible for the process, and those operating it, should own the measures and the costs. Imposed measurements without understanding and commitment by the organization being measured, should be avoided. The concept of ownership being in the hands of the person responsible for the process is in my opinion the largest barrier to total quality management. Without ownership of the process no person will take pride in the work that he does. Ownership will only be achieved if full responsibility and authority is handed down to the person. I am positive that this is what empowerment really means. There are some unions that believe that empowerment means the controlling of an organization by the workers. In a presentation [2], I sketched the following scenario to illustrate the concept of ownership:
Management did not change by itself. I firmly believe that for management to change its style from an autocratic management style to a participative management style, there had to be a driving force behind the move towards total quality management. The driving force can be described as:
Total quality management became an attainable objective when the people who were the driving force moved into senior management positions. They had the vision as to where the company should go to become competitive and have a reputation for doing things right. To quote our Corporate President, Mr Bob Krass, from Carbon Products:
"Our reputation is the most precious thing we own. While quality products and services are the keys to growth and profitability, it is the quality of our reputation that keeps us in business."
There is a lesson to be learnt. Be participative in total quality management and you will reap the personal benefits. Be prepared to receive training at all times. You are never to old to learn. The day you stop learning is the day you die! To attain ownership, the following aspects must change:
To me attitudes and culture go hand in hand. Many gurus define culture as being ethnic. This is correct only in terms of the national culture of an ethnic group. In the business place, culture is something totally different. Business culture is that phenomenon of being part of what develops within a company:
To learn to let go/authority is perhaps the subject I have been propagating the most in all my presentations. Perhaps this is due to the stress suffered in the Defense force in preparing letters that are my own ideas/work and then having it signed by the Adjutant as if it was his work! In other words you did not receive any recognition for your efforts. There comes a time in your career when money alone is not the only satisfying factor and you require some other form of reward. This is called recognition. When you can go home at the end of the day and say "Today was a day well spent". To allow employees to achieve this second dimension, it is essential that full responsibility and authority be delegated to the person performing a task over which he should have full control.
The employee must be able to make decisions with regard to the quality of work, working conditions, better means of performing the task. What is important is that his control must be within the parameters dictated by the system. This is what participative management is really about. Perhaps we should try and coin a better title for this concept due to the miss-interpretation often made by unions and employees. Perhaps empowerment is a better word. There is much miss-conception about the term accountability. Although you have given the employee full control over his activities, you as manager still remains accountable as to the end result. How ever it is important that you as manager must have some form of monitoring to ensure that he is exercising the correct control. This is achieved through the submission of reports at regular intervals to the manager. These reports are there to advise you if things are on track or if adverse trends are developing. Then you as manager should express your pleasure if things are on track or take corrective action if adverse trends are developing. Corrective action does not mean disciplinary action. Most of the time adverse trends can be corrected through training of people or correcting deficiencies in equipment. Disciplinary action should only be taken as a last resort.
It is important that functional structures be established to set the process in motion. Do not confuse personal and organization structures with functional structures. Functional structures are there to facilitate communication and to expedite development of the total quality management system.
Your Total Quality Management System is your own! Do not think it is the same for all companies. Everybody must become part of the system (Remember Attitude/Culture). Total Quality Management is a long term project. Do not give up at the first obstacle, the benefits are too great!
Measurement and actions should be meaningful and support the strategy and objectives of the organization. They should stimulate improvement. Many companies have people taking all sorts of measurements through the use of Statistical Process Control charts, quality reports and check lists. In practice it was found that some organizations had up to two hundred control charts. The question that should be posed is; "How meaningful are these charts?".
It must be remembered that input control is more important than the control of outputs. If the input is under control, the output will invariably be correct. Why waste time on something that is not important and does not contribute to the profitability of the process?
Measurement should clearly identify where the greatest returns will be for improvements. What is important in measurement results is the analysis of the results. The results must tell you whether your process is in control in terms of efficiency and cost. Therefore the results must be compared to a measurement base to see whether you are in control or not. Measurement without comparison is worthless.
The measurement should be fit for purpose and the measurement should be understandable. A high degree of accuracy may or may not be necessary. A high degree of accuracy will be required in terms of product quality and financial statements. When it comes to the assessment of items such as customer satisfaction etc. such a degree of accuracy is not required. What is important here is to see what does your customer think of your product and/or service.
The measurement should be capable of being adapted quickly to changing needs. Measurement systems that are rigid and do not take into account elements such as process capability, market changes and rates of exchange will give a distorted picture of the activity being measured and therefore must be able to adapt to changing needs.
In order to manage the improvement, the establishment of goals and measurable actions are required to allow management to measure, analyze and take effective action. Long term planning; should provide goals for improved gain/cost ratio and should take into account the necessary resources. Short term planning; should translate the long term plan into measurable actions leading to an improved gain/cost ratio. The tree diagram (figure 6) can be used in defining the priorities. Chapter 6 gives detail of the possible techniques to be used.
Pricing is one of the many factors which influence business success and yet is one of the most neglected when it comes to matters such as market sensitivity. It often appears that companies are out there to get rich quickly and do not look at the long term benefits and the life of the organization. This is one of the majors factors to be considered before a product is released on the market. There can be a few red faces in management if the pricing is found to be wrong after it is on the market and the prices needs to be adjusted upwards! In marketing, pricing should be implemented on two levels to account for:
Pricing can be loosely defined as the cost of manufacture plus a profit margin. Pricing can however also be defined as price in terms of intangible as well as tangible qualities. [3] Intangible factors can be listed as:
Tangible factors can be listed as:
Therefore an organization should develop a value-orientated approach to its pricing policy. A firm must ask some key questions before any pricing program is developed:
The use of rule of thumb to determine prices should never be used. Rather, it should be a deliberate procedure of developing a set of objectives and implementing a series of tactics in the organization's marketing program that takes cognizance of product development, advertising, sales strategy, customer support strategy and pricing. There are four pricing objectives that an organization can set in marketing:
A price objective of return on revenue in marketing is desirable when the organization is the low-cost producer in a stable market and the profit on sales is high and the market can absorb the volume at the price established.
To maintain price stability in the market is the desire of all organizations as it eliminates the need to review price schedules at short intervals. Price stability is desirable in a market where substitutes are immediately available and the organization has little chance of developing a value orientation for its products. Price stability is an attainable objective where the customer's options are limited, the product is a significant cost element and the suppliers are limited.
As pricing objectives in marketing, market prestige and image are normally associated with products that have many intangible benefits associated with them. The higher the value level of the product, the higher the price that can be charged. The lower the value emphasis becomes, little product differentiation results and subsequently prices decline.
To meet the competitive price is a popular strategy in marketing where the product is in a price sensitive market or where it is viewed as a commodity. This is especially true with regard to exports where the price is subjected to changes in currency rates and international prices. This happens to raw material that is exported as is and not processed to add value to the product. Pricing in the market place is not easy and numerous factors must be considered when an organization establishes a selling price for its products or services. These factors include, level of competition, the economic structure, product life cycle and the marketing strategy of the firm. In terms of the gain/cost ratio, pricing strategy will have a significant effect on whether you are able to increase the gain/cost ratio.

[1] Proposal submitted by John Marsh of Britain, ISO meeting Australia, 1992, No references.
[2] Grobler J W, The Road To Total Quality Management, A presentation to Consolidated Wire Industries at the Macauvlei Central Training Unit, 29 Sept 1994.
[3] Lancioni R A, Pricing for international Business Development, Management Decision, Vol 29 No 1, 1991, 99. 39-41, MCB University Press Ltd, 0025-1747.
Implementation of a system to measure quality related activities must fall within the scope of a quality policy that has been written and committed to by the highest level of management. Measurement activities to be performed should be documented in works procedures and in work instructions. Typical activities that require measurement are; market research, purchasing, production, incoming inspection, final inspection, sales, customer complaints and service.
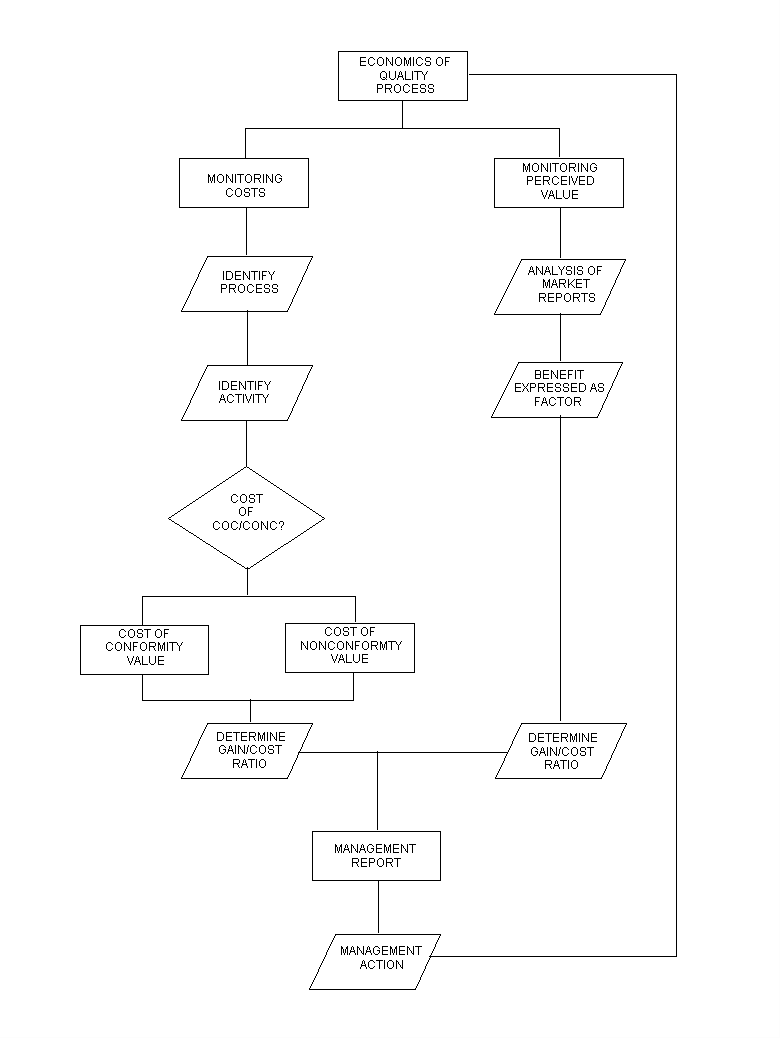
Figure 7 - Economics of Quality Flow chart
The objective of measurements should be to improve new and existing products or services, gain new customers, defining customer needs and to improve the total quality management system of the organization. All these measurements will culminate in the organization having a good reputation that will lead to increased business and gains.
The principles of gain and cost can be found in most economic of quality models and for the purpose of the proposed standard are expressed as follows;
Gain: Gain can be expressed as a factor within the gain/cost ratio that expresses the potential economical benefit for businesses and organizations to maximize gains over a period of time.
Costs: Costs are expressed in monetary values within the gain/cost ratio.
The measurement system that will be discussed now is the basis upon which all economics of quality systems should be developed. As previously stated, many systems had failed or not lived up to expectations due to the organizations not taking cognizance of both the internal and external environment at the same time. The following sub-paragraphs will take the reader through the steps to be taken in setting up a system that will work provided you are committed.
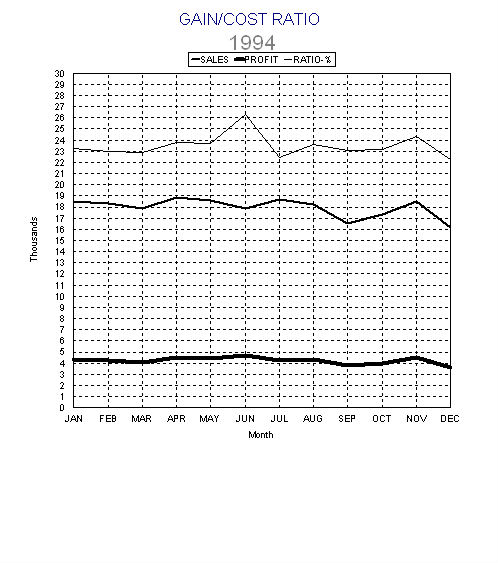
It is recommended that cost data be extracted from the existing financial control system, complimented by operational data from internal and external sources. Data extracted from other sources can be cost quantified and maintained by the organization. Costs that cannot be readily associated with specific quality cost elements should be estimated. If such costs are significant, appropriate records should be established. The objective is to allocate costs and not to absorb such costs into overheads. It is interesting to note that with a standardized costing system people often allocate costs to overheads if they do not know where to place such costs. I would not be surprised if up to twenty percent of overhead costs comprise of hidden operational costs. This statement was confirmed by a study of the department in which I work. Figure 8 illustrating the gain/cost ratio was adapted from the results of that study. EMSA has since changed its financial system to a new system that gives a better picture of actual costs and has resulted in significant cost savings.
Activity Bases Costing is a relatively new concept that fits in well with the philosophy of this dissertation and the reader should take this system into serious consideration. This system allows you to investigate all your activities and then allocate the real costs to where they belong. Potential users are however warned that the level of activity based costing should be restricted to the affordable level of the organization or else you will be creating a new industry within your organization. This means that the level of activity based costing must be restricted to the level of value to the organization, thereafter it is no longer a tool of value. Costs should not be restricted to operational activities only but should encompass all the activities of the organization. It is a good idea to have individuals within departments doing their own budget and expenditure control and analysis so that they can measure and see where the money is going. To allow individuals to budget for and control their expenditure, you are empowering those individuals thus giving them full control of their responsibilities. What is important that their superiors still remain accountable and therefore a system of reporting to higher levels is essential (See figure 7). [1]
Depending on the size of the organization, each department or section will have several processes within. To relate the costs to the process, the processes should be identified and isolated. This can be accomplished by developing a flowchart that shows all the processes in their logical order. Flow charts are essential tools for such work, but appears to have fallen in disuse. Lack of flow charts can lead to critical errors taking place. The outputs from a process should be identified and each output should be recognized as going to one or more customers. The inputs to a process should be identified such as material and data. The controls and resources should also be identified.
The identified process is isolated as a discrete set of activities and given a name or code. Depending on the sophistication of the organization's accounting system it is recommended that the existing cost codes be initially used to identify the activities within each process. The same data base is therefore used to generate a financial report and a management report. This should result in a cost effective approach in implementing the system.
Each activity should be identified as the cost of conformity or the cost of nonconformity. It is possible that as the system is developed it may become necessary to initiate a study of specific activities. This would include activities that have cost of conformity and cost of nonconformity under a single cost code. This is the stage at which an organization must take a careful look at the costs of developing the system any further. The returns or gains that can be made must be weighed up against the expenditure to see if it is worth to pursue the further development any further.
Quality costs should be summarized by the supplier and compared to an appropriate measurement base such as net sales, cost input or direct labor. This comparison will relate the economics of quality to the amount of activity performed. Quality costs may be reported by company, division, facility or department based on the individual needs of the company and the sophistication of the organization's cost system. The amount of detail in the report should depend on the level of management to which the report is aimed at. Top management may require an abbreviated report whilst line managers would require detailed cost information of the area for which he is responsible. Charts should be used to present data and trends in the system for economics of quality.
Responsibility for the administration of the system should be shared with the accounting and quality functions. The processing of quality cost data is best carried out by the accounting department and therefore will add credibility to financial figures. The quality function is best equipped to prepare and publish the graphic reports of trends and supply supplementary interpretation of the quality cost data. It is important that the collection of quality cost data be entrusted to a person with an independent function with proximity to the quality activity.
As stated you should supply top management with only the bottom line figures of the management report. Managers normally do not have the time to scan through pages of figures. However the details should always be available should it be requested. Detailed reports to departmental heads are important as they are the people closest to the activity. Figure 8 is an example of a graphic report to management. The graph as displayed will immediately indicate the areas where the highest gain/cost ratio has been achieved and allow management to develop marketing and production strategies in order to maintain the highest possible gain/cost ratio.
It is suggested that the economics of quality review should become part of your monthly or quarterly quality management meeting. It is important that this meeting should include actualities that will ensure greater focus on quality management matters. The objective of management review is to review if actions have effectively increased gains and/or reduced quality costs. It is here that you should actively question the present system and suggest means of improvement. The results should be:
a) Reviewed at appropriate intervals by management
b) Compared to the plans using the relevant data and
c) Analyzed taking into account the changing business environment.
The review should bring trends to the attention of management. Management should react timeously to the results of the review after considering the effects on both long term and short term plans.
In order to budget for the activities of an economics of quality system you need to identify the investment needed through the following:
The investment in information could be considered as a once off cost that is expended in developing the system. This could entail the adaptation of the existing data system to suit your needs. Once this is done, the cost of increasing information should be minimal because of the fixed initial investment. Investment in management time could be considered as a variable expense, i.e. the more management time needed, the more it will cost. Capital expenditure for the initial installation of an economics of quality system must be carefully considered before proceeding on the project. This is a system that can have a snowball effect with disastrous financial consequences to an organization. It is best to start on a small scale at first, see how the system functions, determine the probable gains and then only decide on the depth of analysis and subsequent reporting required. The objective is to increase gains and not costs.
The objective of information to management is to monitor the performance of key performance indicators and to manage any deviation from plan. Therefore this information has a significant influence on management decision and planning processes. Information must therefore be relevant and concise (bottom line figures only). In the context of information to management, the information must provide answers to such questions as:
Therefore to meet the information requirements that relate to performance measurement it must be decided as to what has to be measured, how, when and what values should be attached to the measurements. These values can be in terms of time, volume, accuracy or monetary units. [2]
Time measurements may be expressed as how long, how late against a predetermined schedule.
Volume measurements are normally in terms of units processed or inputs of raw material, electricity or gas.
Accuracy measurements can be related to quality, rejects, errors or level of conformance to requirements.
Monetary measurements are usually expressed as costs per unit, total costs or profits before or after tax. All the units should be graphically displayed on a X/Y axis, using the X axis to denote time and the Y axis to denote the unit of value. This is a requirement if you wish to evaluate trends. If these guidelines are followed in preparing management information reports, managers will be able to select and analyze those measurements most useful and cost effective to them. This information will then be meaningful in the support of managing the business.
[1] Proposal submitted by Johann Grobler, ISO meeting Budapest, 1993, No references.
[2] Sharratt J and McMurdo A, Managing the information explosion, 1991, MCB University Press Ltd, ISBN 0 86176 5222 2.
Customer satisfaction is that element of industry that is difficult to quantify and yet the success of industry depends totally on it. What organizations sometimes lose sight of is that customer satisfaction is the culmination (result) of the inputs made by the organization. This means "garbage in results in garbage out" and customer dissatisfaction. This chapter is dedicated to means of influencing customer satisfaction to the benefit of the organization and most importantly the customer. Without customers an organization will not survive.
An organization should reduce dissatisfier factors and provide more satisfier and delighter factors. If this can be achieved then it may be possible to increase income by gaining new customers, regaining lost customers while retaining current customers. This will happen because customers will consider organizations that are regarded as to be the best desirable supplier for the offered products.
If the organization offers such a range of delighter factors and satisfier factors while committing no dissatisfier factors, the products may be able to command a higher price. This will therefore increase the gain/cost ratio. The customer will still perceive this to be good value considering all the other factors. A thorough evaluation of the three customer satisfaction factors will significantly increase the prospects for success if an organization plans to enter a new market. A good reputation for customer satisfaction in the current market will also be a major asset. [1] To clarify the scope of the economics of quality working group, the members decided upon the following explanation for Satisfier, delighter and dissatisfier factors:
Satisfier: A satisfier is an expected condition or event that leads to the fulfillment of the customers stated or implied needs.
Delighter: A delighter is a positive condition or event that is not expected by the customer that leads to beyond stated or implied needs.
Dissatisfier: A dissatisfier is a negative condition or event which is not expected by a customer that leads to a decrease in customer satisfaction.
This is a very simplistic viewpoint, but the members felt that the requirements of the standard did not warrant a larger scope of the concept of customer satisfaction. Delighter factors, satisfier factors and dissatisfier factors are not static, rather they are highly dynamic. Delighter factors that have been experienced a few times (or perhaps even once) may become satisfier factors. It is for this reason that the expenditure in providing delighter factors must be carefully assessed. Delighter factors can so easily be regarded as gimmicks and therefore it is prudent to rather have a first time right approach to the product and service that an organization offers. For example; Purdey's of London is known for its conservatism and renowned for delivering a quality product.
Figure 9
A single dissatisfier factor will have negative effect of 'X'. A second dissatisfier factor will cause a cumulative negative effect much larger than 'X'. [2] There is a similar positive effect for delighter factors. More satisfier factors results in more satisfaction. The author is of the opinion that this statement is not quite true. A customer that is satisfied will stay satisfied irrespective of the more satisfier factors. Delighter factors passed on to the customer becomes the new standard and if you do not maintain the new standard it becomes a dissatisfier factor.
A satisfied customer will remain with you as long as the competition offers nothing better, but a delighted customer will remain even in that case. Therefore, you should always anticipate customer's future needs and meet these before the customer asks for them. It is possible, but highly unlikely that a dissatisfier factor can be counteracted through prompt re-action by the supplier. Therefore it is doubtful if customer satisfaction can be improved after a dissatisfier factor if the recovery and the response by the supplier is a delighter factor. The aftertaste of dissatisfaction can not be immediately removed. We are humans with human reactions.
Customer satisfaction is necessary for continued survival of an organization. A lack of attention to customer satisfaction and the factors which create it, will have significant economic effects. The higher the level of customer satisfaction, the larger the gain/cost ratio. This statement only becomes true if as a result of improvement, you are able to command a higher price. The objective of eliminating dissatisfier factors first is significant because delighting a customer who is experiencing dissatisfiers is rarely possible. Actions which are unsuccessful in the presence of dissatisfier factors, may never-less satisfy the customer once the dissatisfier factors have been removed. What this means that concerted efforts by the supplier to remove dissatisfier factors in order to meet customer requirements could be appreciated by the customer and have a positive influence on future business transactions.
It is possible to relate the gain/cost ratio to the concepts of dissatisfier factors, satisfier factors and delighter factors. Permitting the dissatisfiers to occur hurts the gain/cost ratio in two ways. It drives up the costs due to the need to remedy the problem and its results in a loss of customer satisfaction and possibly customers. Additionally it also hurts the reputation of the supplier (organization). This means that dissatisfier factors cuts to both sides. A reduction in the cost component of the gain/cost ratio is best accomplished by efforts to reduce the frequency and duration of dissatisfier factors. The area of dissatisfier factors and cost is likely to be the best choice for initial work.
While dissatisfier factors are being brought under control, careful study of the satisfier and delighter factors as viewed by the customers should be undertaken. Appropriate actions to implement practices which result in customer satisfaction should be carried out. The process concept to realize customer satisfaction is illustrated as a decision loop in figure 9. [3] The objective of figure 9 is to illustrate the concepts of market analysis using a questionnaire to evaluate the perception the customers have of the organization and then for management to decide on the appropriate action to resolve any concerns that have been identified. The decision loop is critical if you wish to achieve customer satisfaction. It is also important to realize that customer satisfaction means that you must not look just at the customer but also at yourself.
Activity Based Costing is a useful management tool and in chapter 8, we will discuss how to get started with a quality cost reduction program using Activity Based Costing and implementing the system at minimum cost.
References:
[1] Proposal submitted by Robert Kennedy of the United States of America, ISO meeting Australia, 1992, No references.
[2] Proposal submitted by Robert Kennedy of the United States of America, ISO meeting Australia, 1992, No references.
[3] Proposal submitted by John Marsh of Britain, ISO meeting Paris, 1994, and subsequently adapted by the author. No references.
To start a quality cost program, it is best to take one facility at first and run a trial program. Take a facility that is not complex as you are going into a learning curve and complex facilities will only make the learning more difficult. [1]
The following steps should be followed:
Keep the program simple by selecting only the major costs and only data that is readily available. Your present standard costing system will be able to supply you with much of the data required for the trial program.
"An important point is that it must be clearly understood that Activity Based Costing does not replace, but uses standard costing as a data base to give management a tool for sound decision making. Standard costing meets certain legal requirements that cannot be fulfilled by Activity Bases Costing".
If you wish, it is possible to adapt the standard costing system, through the use of cost codes to give you the best of both systems.
To determine prevention costs to be collected, list the activities the facility performs to prevent discrepancies. It is suggested that the departments are listed with the activities there under for when it comes to reporting, it will enable department heads to take specific action. This will become more clear as we proceed.
Appraisal costs are determined by listing the activities associated with the inspection and test of product for the detection of discrepancies.
For failure costs, you need to determine those costs which would have not been expended if you had no discrepancies. This information can be extracted from the standard costing system or cost quantified from the monthly scrap report. If you train your financial people in the basics of PAF (Cost of conformity/non-conformity), They should have no difficulty in analyzing the standard cost system and allocating costs to PAF (Cost of conformity/non-conformity).
This is the part of the system where many companies come up against a brick wall that appears to be impossible to breach. This is the point where companies are under the impression that the standardized costing system in use must be changed.
PLEASE DO NOT TRY AND RE-DESIGN YOUR PRESENT REPORTING SYSTEM!
Re-designing your reporting system will result in a costly exercise with no gains to be made. If you have followed the steps of allocating costs in terms of prevention, appraisal and failure costs, the collection of data from the standard costing system, which will be fairly easy if accessed through computer programs, you will eliminate the need for time study officials. It is however possible, that as the system develops and you see the need for more information, it may be required to complete studies of specific activities. These could be for different activities or elements all under one cost code. As a start, it is suggested that you interview the responsible person. He will most probably be able to tell you what the split is. Do not under estimate the man on the floor!
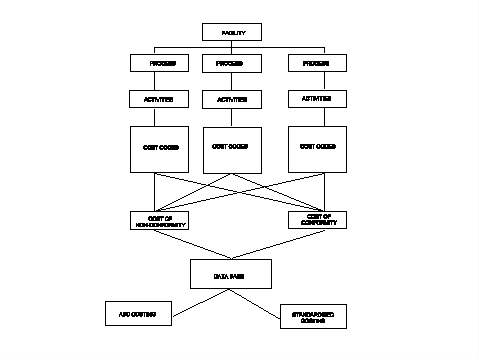
Figure 10 - Cost Relationships
The collection of data for identified activities that are not readily available is another kettle of fish.
There are two methods of collecting such data:
What is interesting is that items that have been hidden under overheads will now come to the fore and assume their rightful place in the costing system. Please remember that initial cost identification and collection is a major task and should be allocated to a person that can spend all of his time on the project. It is also advisable to delegate a person who will later assume responsibility for the cost of quality and the reporting to management.
Figure 10 illustrates the identification of process, activities, the allocation of cost codes into PAF (Cost of conformity/non-conformity) and the central data base used by Activity Based Costing and standard costing. The prevention, appraisal and failure costs can be replaced by the cost of conformity or the cost of nonconformity depending on your personal preference.
The preparation of a summary and analysis is a tricky task as it depends on the type of manager who reads this report. Out of experience, the best method is to prepare a short and concise report for top management. This report must give the bottom line figures and as an attachment, the detailed report.
Managers hate to read a hundred page dissertation and seldom have time to do so. If he wishes to study details, it is available to him in the attachment. To department heads, only give the summary and analysis that is applicable to that department. It saves the department head the effort of paging through the report to find what is relevant. It is also not wise to give information of a department to other departments as this can easily lead to comparison and conflict.
The first analysis to complete is a trend analysis of total quality costs, prevention costs, appraisal costs and failure costs. As you increase prevention and appraisal costs, there should be a corresponding reduction in failure costs. At the same time there should be a steady reduction in the total quality costs.
The second analysis is to compare total quality costs against a measurement base. You can compare total quality costs to an appropriate measurement base such as net sales, cost input or direct labor. This comparison will relate the cost of quality to the amount of work performed.
Quality costs normally increase in proportion to increases in the measurement base. It is the non-proportionate change that should be of interest (The range). The index (Total quality cost over Measurement base) is the factor to analyze. Management objective is to bring this index to the point of most economical operation. In the preparation of graphic analysis, it is recommended that the quality function be delegated as they have the expertise to interpret and statistically present data for the report. The reason for this is that quality assurance is able to pinpoint items such as failure costs that have moved out of line through the use of Quality Assurance Engineers who will have first hand knowledge of the occurrence.
A trial run should have some startling results as experience has shown that quality costs can be as high as 20% of net sales. Such results are bound to make management sit up and take notice and give the go ahead for the project. This data should be plotted on a monthly basis for management review and setting of objectives.
The objective of a management review at appropriate intervals, is to set objectives and justify actions to effect quality savings. Therefore the principles of managing quality related costs/benefits is to provide management with methods of identifying, measuring and managing quality costs, but more importantly to create opportunities for quality savings.
It is suggested that the economics of quality review should become part of your monthly total quality management meeting. It is important that this meeting should include actualities that will ensure greater focus on total quality management. It is here that you should actively question the present systems and develop means of improving them. Total quality management must not just be talked about it must become a way of life.
In order to budget for an economics of quality system, you need to identify the investment needed through the following:
The investment in information could be considered as a one off cost that is expended in developing the system. This could entail the adaptation of the existing data system to suit your needs. Once this is done, the cost of increasing information needs is minimal because of the fixed investment. Investment in management time could be considered a variable expense, i.e. the more time needed the more it will cost.
Economics of quality can be one of the most powerful management tools available to an organization if you are prepared to make the effort. Remember to implement the system will not be a cake walk as there will be many difficulties to overcome, but the financial rewards will more than offset the effort. Do not give up, but press through. So many systems have failed because management gave up at the first sign of difficulties. Economics of quality must be regarded as an opportunity to make your organization more cost effective and more competitive.
[1] Grobler, J W. The economics of quality - Calculating the cost of quality. International Institute for Research, Presentation on 21 Oct. 1992.
This presentation was made at the start of my research into the various aspects of the economics of quality . This took place at the BIFSA auditorium at Midrand, near Johannesburg on 21 October 1992, two weeks before my departure to represent South Africa at the annual ISO meeting at the Surfers Paradise in Australia. It was the first time that I was called upon to address a group of industrialists and it was a tremendous learning experience. The paper as submitted will be reflected in full, with the transparencies of graphs as figures in this attachment. The paragraphs represent the salient points in order to provoke interaction between presenter and audience. Paragraphs that are in bold script are transparencies used and for the purpose of the dissertation, not reflected separately. This attachment is referenced to in chapters 2 and 7.
The concepts of economics of quality can be traced back as far as the early 50's when J M Juran in the first publication of the :Quality Control Handbook" discussed the economics of quality. Western industries paid little or no attention to the subject as most companies were making substantial profits in spite of the waste taking place during production.
We had to wait for the hard realities of real competition to hit us before we would sit up and take notice of what has happening in the international world of business. For some companies it has come to late and they have fallen by the wayside.
In South Africa, today we must take a hard look at the economics of quality and move into action immediately if we wish to become competitive in the international market place to become competitive, we must become "MEAN AND LEAN". The question can be posed if industry at large is not doing it the wrong way by reducing staff? By reducing staff you are distributing wealth amongst fewer people and at the same time increasing unemployment. This does not mean that organizations should become charities, but rather increase productivity and sales.
"It has taken the western world 42 years to address the economics of quality. Total Quality Management, economics of quality will be one of the last frontiers to be crossed".
The reason for the lack of attention is that many organizations have been afraid to tackle this subject. What we are going to discuss is the relationship and interdependence of Prevention, Appraisal and Failure costs to Activity Based Costing.
Economics of quality can be defined as:
"The management of all operations within an organization in order to strike the correct balance between the cost of quality and the value of quality to ensure competitiveness and profitability"
It is important for a company to determine the value (importance) of quality required for the product they are producing. Once this value is known, the cost (level) of quality can be determined.
Harold Freeman in 1960 and A V Feigenbaum in 1961 were amongst the earliest to categorize quality costs into Prevention, Appraisal and Failure costs. The reason for categorizing is to allow management to measure, analyze and take effective action. This is the bottom line of all management functions.
We are going to look at prevention, appraisal and failure costs from a slightly different point of view. The objective is to demonstrate the importance of measurement and why you should be measuring these costs. We have all at some or other stage received tuition on the PAF model, but no one has really told us what to do with it in practice.
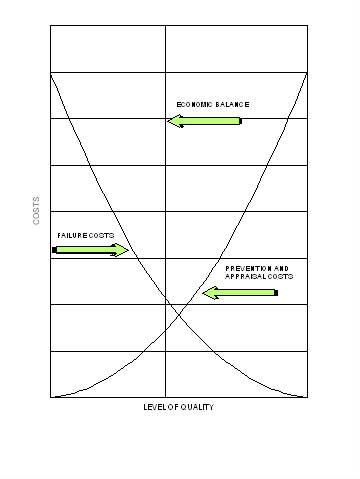
Due to this limited knowledge, there appears to be a negative attitude towards the measurement of quality costs. Some people have gone as far as expressing these elements as the costs of conformance and the costs of nonconformance. No matter how you look at it the underlying principles of managing the costs of quality to ensure profitability, remains the same.
The measurement of prevention, appraisal and failure costs over time can be depicted as model 1. A reduction of failure costs should occur with a corresponding increase of prevention and appraisal costs. The reduction in failure costs will be dramatic at first and less so as you strive to reach zero defects. To reach zero defects is of course unlikely but with an effective cost reduction program, you should be able to achieve much more than at present.
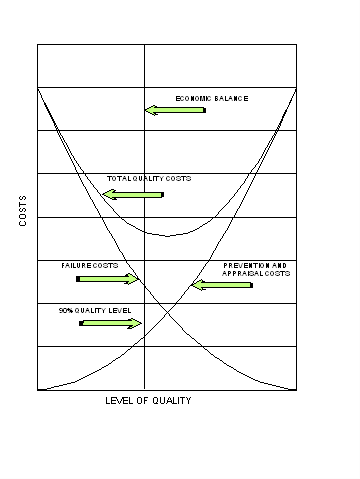
Model 1
Model 1 depicts a stage when the two lines cross and this is often described as a break even point. However in the economics of quality, this is not the case. You will notice that the economic balance line is at a point different to the break even point. The question now arises as to why this is so. This can be ascribed to a third element in economics of quality called total quality costs.
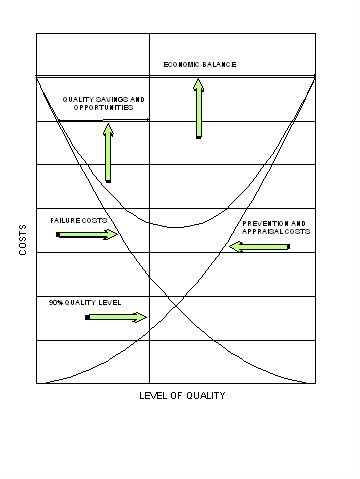
Total quality costs is the sum of appraisal, prevention and failure costs. Model 2 includes total quality costs as a third line and it will be noted that this line does not follow the normal pattern of high/low or low/high. Total quality costs reaches a low point and thereafter it increases again. What this illustrates is that total quality costs should be measured and monitored and if it starts to increase you have either regressed in the cost reduction program or more importantly, you have passes the economical balance point. In terms of quality, the economic balance point will never reach the break-even point of costs as you will never reach 100% quality due to the human factor and the real cost of quality. To reach 100% quality, you must be perfect and no man or machine is perfect.
If you have passed the economic balance point you are in the are of "over quality". As much as under quality is undesirable, so is over quality, as over quality can mean that possible profits are being spent without cause. Refer to the definition for economics of quality and you will see how relevant over and under quality becomes.
The line on the right of model 3 depicts the area of quality savings or opportunities that can be realized by the application of a quality cost program. It is as described by Juran, "gold in the mine" waiting to be extracted. This is where the relationship between PAF and Activity Based Costing becomes so important as PAF allows you to implement Activity Based Costing with the minimum of hassles.
Through the use of a technique such as Activity Based Costing, the area of opportunities and savings can be identified and be used in setting objectives in reducing quality costs. It must however be emphasized that the diagrams we have just looked at are models and when graphic analysis is made in practice, they will bear little or no resemblance to the models illustrated. Graphic illustrations that are used in practice would indicate trends in the cost reduction program over a period of time. If long term analysis is done of the data since the start of the program, you may come up with something that could resemble half of the model. It is however debatable whether the exercise is worth the effort.
The objective of this presentation was to give you a new perspective of the quality cost model and to stimulate ideas on how to approach the cost of quality.
[Return to Simply Quality]